Appearance
Plotting 5 Most Popular Languages on AO3
tags: Python Seaborn barplot
Data Cleaning
Let's quickly go over how we load file, select column, and find the 5 most popular languages on AO3. For detailed explanations of what's going on, check out previous posts on this subject.
python
# Load Python library
import pandas as pd

# Load file
path="/home/pi/Downloads/works-20210226.csv"
chunker = pd.read_csv(path, chunksize=10000)
works = pd.concat(chunker, ignore_index=True)

# Select language col, drop na values, count frequencies of each language
top = works.language.dropna().value_counts().reset_index()
top.columns = ['language', 'work_count']

# Choose top 5 most popular languages
top5 = top[:5].copy()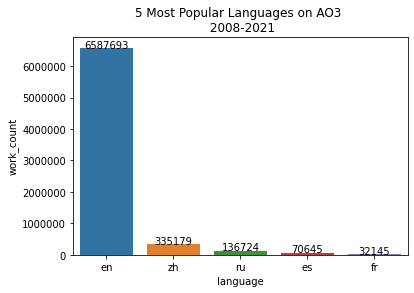
top5| language | work_count | |
|---|---|---|
| 0 | en | 6587693 |
| 1 | zh | 335179 |
| 2 | ru | 136724 |
| 3 | es | 70645 |
| 4 | fr | 32145 |
Simple Bar Plot
We use Seaborn library to plot the data into a simple bar plot.
python
# Import libraries
# Top line is Jupyter Notebook specific

%matplotlib inline

import matplotlib.pyplot as plt
import seaborn as sns
python
# Plot using Seaborn library
ax = sns.barplot(x="language", y="work_count", data=top5)

# Add title
ax.set_title("5 Most Popular Languages on AO3 \n 2008-2021")

# Prevent scientific notation with ticklabel_format()
ax.ticklabel_format(style='plain', axis='y')

# Add number annotation
for i in range(0,5):
    ax.annotate(str(top5['work_count'][i]), xy=(i,top5['work_count'][i]), horizontalalignment="center")